

The 2016 pass defense SAVAGE ratings are based on last years performance as well as the number of returning starters.
Comprehensive SAVAGE rankings available here: Complete Rankings
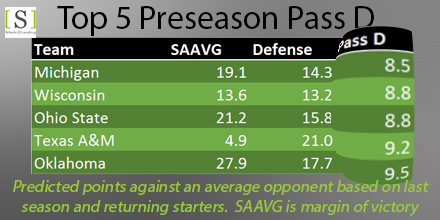
SAAVG – Margin of victory against an average team
Defense – Points scored by an average team
Pass D – Points scored through the air by an average team
Top 25 Pass Defenses
| Team | SAAVG | Defense | Pass D |
| Michigan | 19.1 | 14.3 | 8.5 |
| Wisconsin | 13.6 | 13.2 | 8.8 |
| Ohio State | 21.2 | 15.8 | 8.8 |
| Texas A&M | 4.9 | 21.0 | 9.2 |
| Oklahoma | 27.9 | 17.7 | 9.5 |
| Marshall | 9.7 | 21.5 | 9.5 |
| Alabama | 25.4 | 13.5 | 9.8 |
| Florida State | 20.5 | 17.5 | 10.5 |
| Missouri | -4.7 | 17.3 | 10.5 |
| Florida | 8.3 | 17.8 | 10.6 |
| UCLA | 8.8 | 23.2 | 10.6 |
| Washington | 14.1 | 17.8 | 10.8 |
| San Diego State | 13.9 | 17.5 | 11.2 |
| Connecticut | -2.3 | 21.5 | 11.4 |
| Northwestern | 0.2 | 19.6 | 11.4 |
| Georgia | 10.2 | 19.4 | 11.6 |
| Vanderbilt | -6.4 | 19.9 | 11.7 |
| Boston College | -1.7 | 17.5 | 11.7 |
| North Carolina | 17.9 | 25.0 | 12.0 |
| Appalachian State | 16.4 | 20.1 | 12.0 |
| West Virginia | 15.2 | 21.2 | 12.2 |
| Texas | -0.8 | 26.0 | 12.2 |
| Tennessee | 23.8 | 19.9 | 12.7 |
| Mississippi St | 12.5 | 23.5 | 12.8 |
| Stanford | 14.9 | 21.6 | 12.9 |