

The 2016 rushing offense SAVAGE ratings are based on last years performance as well as the number of returning starters.
Comprehensive SAVAGE rankings available here: Complete Rankings
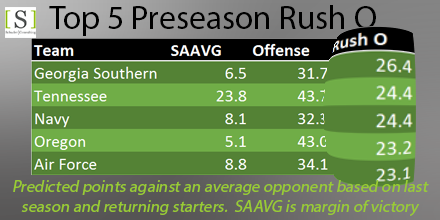
SAAVG – Margin of victory against an average team
Offense – Points scored against an average team
Rush O – Points scored on the ground against an average team
Top 25 Rushing Offenses
| Team | SAAVG | Offense | Rush O |
| Georgia Southern | 6.5 | 31.7 | 26.4 |
| Tennessee | 23.8 | 43.7 | 24.4 |
| Navy | 8.1 | 32.3 | 24.4 |
| Oregon | 5.1 | 43.0 | 23.2 |
| Air Force | 8.8 | 34.1 | 23.1 |
| North Carolina | 17.9 | 42.9 | 21.0 |
| LSU | 15.3 | 36.2 | 20.6 |
| Alabama | 25.4 | 38.9 | 20.5 |
| Appalachian State | 16.4 | 36.6 | 20.0 |
| Clemson | 24.6 | 46.4 | 19.6 |
| Baylor | 17.7 | 43.9 | 19.6 |
| Ohio State | 21.2 | 37.0 | 18.7 |
| South Florida | 10.2 | 34.7 | 18.7 |
| Stanford | 14.9 | 36.5 | 18.7 |
| Houston | 20.4 | 41.6 | 18.7 |
| San Diego State | 13.9 | 31.5 | 18.5 |
| Arkansas State | -0.6 | 35.3 | 18.5 |
| Syracuse | 1.0 | 34.6 | 17.8 |
| Notre Dame | 16.3 | 41.5 | 17.6 |
| West Virginia | 15.2 | 36.4 | 17.4 |
| Oklahoma | 27.9 | 45.7 | 17.4 |
| Georgia Tech | -0.1 | 27.8 | 17.3 |
| Auburn | 7.2 | 32.4 | 17.2 |
| NC State | 5.4 | 33.5 | 16.0 |
| Utah | 9.8 | 31.3 | 15.9 |